Tuesday 11 August 2015

Linked Pasts

As Pelagios 3 and 4 are getting close to wrap up, we hosted an event at KCL in London called Linked Pasts. We've been meaning to write a post about it but our friend and fellow-LOD-traveller Holly Wright has just done a terrific job describing it over at the ARIADNE blog and so it seems to make sense to point you over there. We're hoping to arrange similar events in future so if you're interested in how the Linked Open Data ecosystem for the humanities is evolving then let us know and perhaps even consider hosting it!

We'll post links to the presentations shortly, but in the meantime you may want to check out the reports of the people, places and periods breakout groups. A huge thanks to everyone who took part for making it such a success (and especially to Gabriel Bodard who really helped us pull it all together).

Linked Open Data Ecosystems. With Cats.


Tuesday 7 July 2015

Peripleo: a Sneak Preview

There's been quite a loooong silence on this blog about our tool development activities. Not that we've been idle. Far from it: we've been as busy as ever in our top-secret underground hideaway. Those of you following us on twitter may have noticed the occasional screenshot or info-bite leaking out. But today we're finally ready to give you a first comprehensive sneak preview of what we've been up to: the development of a spatio-temporal search engine for Pelagios. Everyone, meet Peripleo.

Peripleo is Greek for "to sail (or swim) around", and the notion of being able to freely navigate the "sea of open data", collectively brought together by our partners (and discovering the treasures hidden in remote places and ancient times!) is exactly what we had in mind when we started out.

Example 1: Tetradrachm

To see how Peripleo works, let's take a swim through two examples. First, let's search for 'tetradrachm', a particular coin type. This brings us to the following result, shown in Fig. 1: a total of 23,346 hits, and a map with a distribution of lots of small dots (and one slightly larger than the rest), indicating where those results are located. We also get some preview images for our results.

Fig.1 Search results for 'tetradrachm'.

Let's flip open the 'filters' panel to find out a bit more about those results (Fig.2). The filters panel shows us how our result data are organised. In this case, it tells us that most results come from the American Numismatic Society Collection, with a small fraction of hits (hovering the mouse over the bars tells us there are nine) coming from the Fralin | UVa Art Museum Numismatic Collection. We can also see how our results are distributed over time, between the 6th century BC and 3rd century AD, with the peak at around 300 BC.

Fig.2 Filter panel.

We can go exploring further too, by, for example, zooming in on Sicily (Fig. 3). Since the information on our side panels will update live as we go, we can see how our results change as we zoom in. We can see that our current map area contains a subset of 892 results (out of our total of 23,346). Interestingly, we can also see that the distribution over time has changed: results around Sicily date roughly to between 500 and 200 BC, i.e. to the earlier phase of our total result set.

The biggest dot in the region indicates the place with the most results. Clicking it reveals that it's Syracusae, and that 520 of our 892 results in the area are linked to it. We can move the map around to explore how the temporal distribution differs in other areas; and all the time Peripleo will live-update the contents of the filter panel, as well as the image previews.

Fig.3 Results around Sicily.

Let's take a break and zoom back out, so that we can view all our results again. You may notice handles around that blue time distribution graphic. These handles are draggable. Let's pull them to select a time range in the beginning of the graphic: somewhere between 500 and 400 BC, say. Peripleo now shows results only from that time span. If we drag the selected range across the graphic, we'll see how the geographical spread of our results changes over time. Fig. 4 shows the map at the start (Fig.4, left) and end (Fig.4, right) positions of this shift, with distinctively different 'footprints' at the beginning and end of the overall time period.

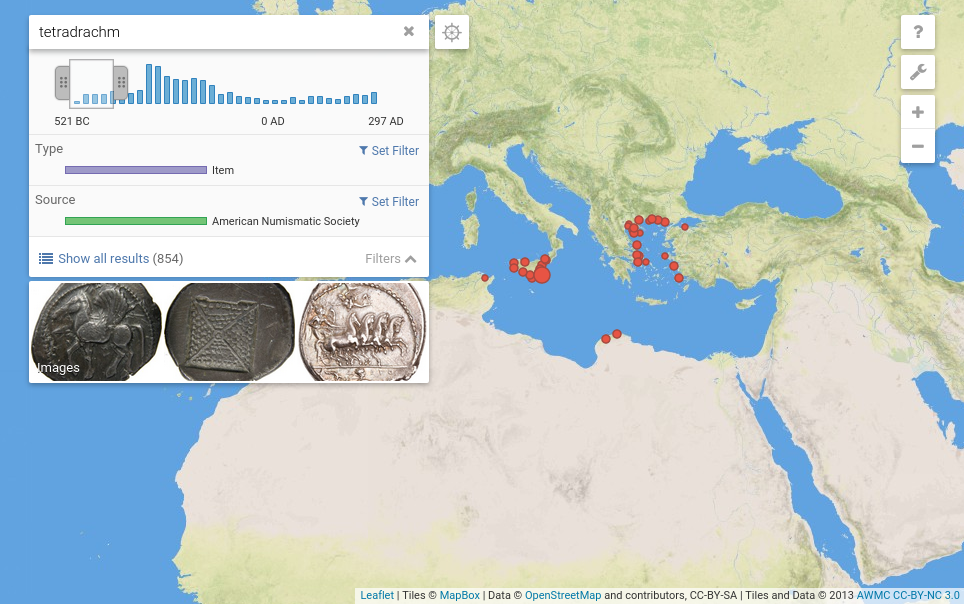
Fig.4 Results filtered by time.

Needless to say, once you have narrowed down your search to specific items you are particularly interested in, you can go directly to the source of the data. In our case, it could be one of these item pages at the American Numismatic Society MANTIS system, for example.

Example 2: Theatres

Let's try another example and search for the term 'theatre'. This time, Peripleo comes up with a handy set of 483 results (plus some corresponding preview images). The filters panel tells us that results come primarily from Vici.org and the Flickr photostream of the Aerial Photographic Archive for Archaeology in the Middle East. Before exploring any further, though, let's first switch the backdrop to an aerial imagery baselayer (Fig. 5).

Fig.5 Map layer settings dialog.

Now let's move the map to a region we're interested in, say North Africa. Again, thumbnail images will update as we go along; and hovering over a thumbnail will place a marker at the location the thumbnail is from. Let's take a closer look at one of the results by clicking on its thumbnail (Fig. 6).

Fig.6 Aerial imagery baselayer.

The map will zoom in on the place we selected: a Roman theatre at Djemila, Algeria, that's recorded in Vici.org. Peripleo indicates that no additional data is linked directly to the theatre. But let's see whether we can find something interesting in the area around it. We can do this by clicking the blue 'explore this area' button, next to the search box. Peripleo brings up markers for other places nearby, sized according to how much data there is available for them. In this case, we can, for example, quickly spot the marker for Cuicul, the main settlement, which is linked to 133 inscriptions recorded in the Epigraphic Database Heidelberg.

Fig.7 Exploring an area.

But Wait - There's More!

This illustrates some of the things that you'll be able to do with Peripleo. But there are more things coming! For example: the scenarios above might give the impression that Peripleo is limited to treating places as points; and each item needs to be located at one specific place. That's not the case. Places in Peripleo can cover regions - see e.g. a search for 'galliae' in Fig. 8 (left) below. (Peripleo makes use of the Creative Commons 'Polygon Shapes for Pleiades Regions' dataset by Pedar Foss, AWMC.) Items can be connected to anything from a single place, to thousands - see e.g. a search for 'vicarello' in Fig. 8 (right), which returns, among other things, the Vicarello Beakers and the entire Itinerarium Gaditanum inscribed on them (along with the beautiful CC-BY photographs by Ryan Baumann).

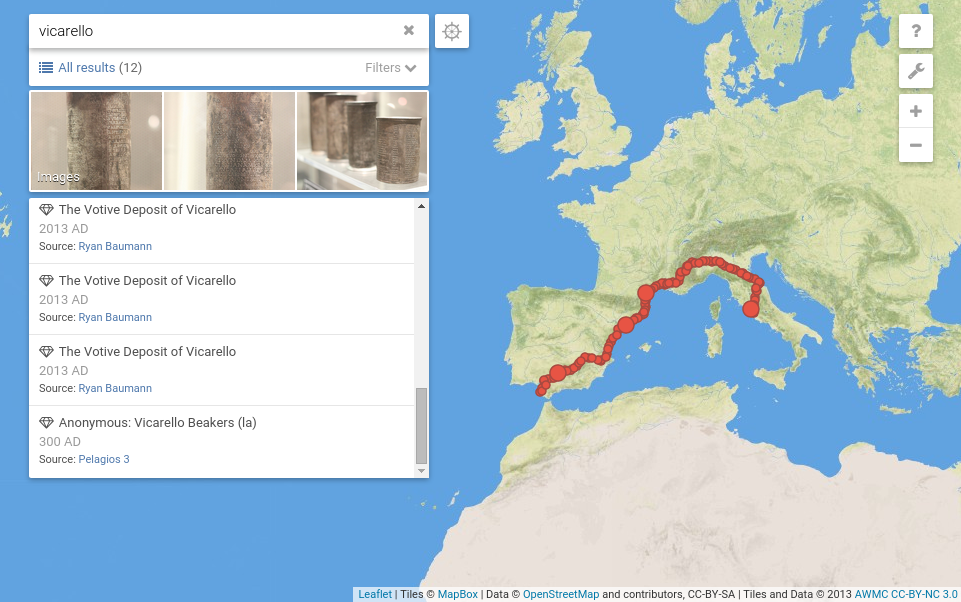
Fig.8 Regions (left) and complex items (right).

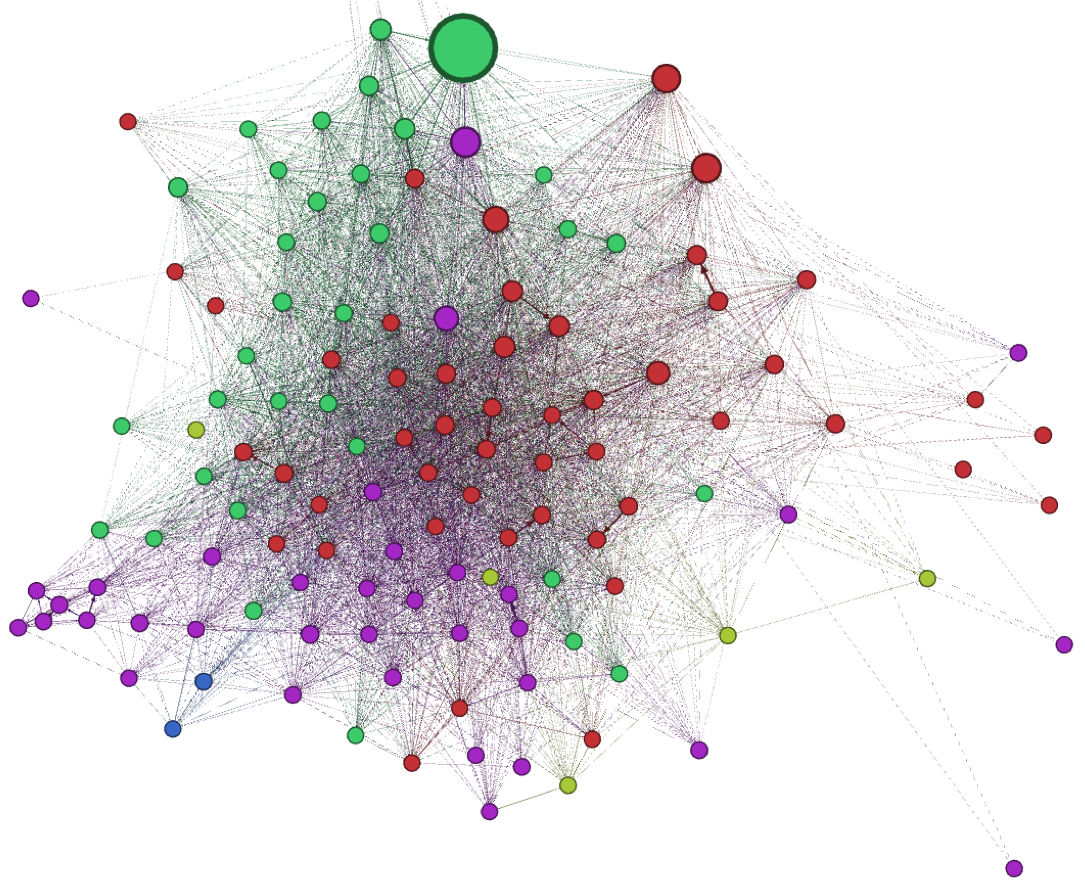
We feel that Peripleo offers a tantalising glimpse into a new way of doing research, of discovering what's in the data, and revealing connections that would otherwise have been much harder to trace. Yet this work marks only the first steps towards tapping into the vast potential of the digital resources brought together by our partners, collectively and openly. That is to say, Peripleo is still a work in progress. Or, as I like to say, playing with Peripleo isn't "beta testing" just yet, but rather like taking a stroll across a busy construction site. Nonetheless: we're really eager to get first test users into the system, and find out what YOU think. What works? What doesn't?

So, if you're not afraid to put on your hard hat, and don't mind stumbling across the occasional unfinished area - we'd love to invite you to have a play with Peripleo yourself. Do drop us a line if you're interested to take a look & we'll give you access right away. We'd love to hear your feedback!

Thursday 11 June 2015

Return to Gaul

This post has been written by first-year students of the master "Humanités classiques et humanités numériques".

We are French students in the master “Classical Humanities and Digital Humanities” at Paris-Ouest Nanterre La Défense University. One of our courses is a short collaborative project and we decided to contribute to Pelagios. The interdisciplinary and contributive nature of this project on ancient places makes it very relevant for students like us.

Due to our background, we were immediately interested in the way literary texts are dealt with in Pelagios. The idea was to choose a text and mark up all place names we would find with the Recogito tool. Our aim was to have a direct experience of the issues raised by digital editing, one of the core activities of digital humanists. Through the actual marking up of Rutilius Namatianus' De reditu suo (a text describing his return from Rome to Gaul – see the map) and the collaborative revision process, we realised that it was not that easy, in some cases, to determine whether a word was indeed a place name and, if so, whether it had to be marked up and indicated on the map. For instance, one special feature of ancient texts is that they frequently refer to mythological places. But is a mythological place really a place in this context? Should we mark up Mount Olympus when it appears as the home of the Greek gods?

When a place is designated by the name of the people who live there, it is not always clear whether the narrator means the country or the people. Marking up texts thus turned out to be a captivating, even philosophical, activity and those who claim it tiresome have, no doubt, malicious tongues.


Tuesday 24 March 2015

Linked Pasts

The Pelagios project is pleased to announce a two-day colloquium on the subject of “Linked Pasts”, 20-21 July 2015, at KCL (The Great Hall, The Strand Campus). Bringing together leading exponents of Linked Data from across the Humanities and Cultural Heritage sector, we address some of the challenges to developing a digital ecosystem of online open materials, through two days of position papers, discussion and breakout group activity. Day 1 will tackle the themes of Time, Geo and People, and issues of Open Data, Classification Schemes and Infrastructure. Day 2 will be devoted to two parallel structured activities, one exploring Niches (space, time, people), and the other Nutrition Cycles (open data, classification, infrastructure). For details of the line up of talks and contributors, see below.

Refreshments (tea/coffee, lunch) will be provided, along with a reception on Monday evening.

The event is free of charge but places are limited. Please reserve your place through Eventbrite.


Matthew Paris: Itinerary from London to Jerusalem. CC0
(http://commons.wikimedia.org/wiki/Category:Maps_by_Matthew_Paris)

Day 1
   Welcome – Pelagios: A Linked Pasts Ecosystem?
   Keynote – Sebastian Heath (NYU), Does a Linked Future Mean Past Understanding?    

Session 1       
   Time – Ryan Shaw (UNC), An Ecosystem of Time Periods: PeriodO
   Geo – Ruth Mostern (UC Merced), An Ecosystem of Places: Gazetteers
   People – Gabriel Bodard (KCL), An Ecosystem of People: SNAP
           
Session 2       
   Open Data – Mia Ridge (OU), Trends and Practice within Cultural Heritage
   Classification schemes – Antoine Isaac (Amsterdam), Europeana

Day 2 
Session 3: Towards an Infrastructure
   Rainer Simon (AIT): The Recogito Annotation Platform
   Humphrey Southall (Portsmouth): PastPlace gazetteer
   Guenther Goerz (Erlangen): WissKI
   Holly Wright/Doug Tudhope: Ariadne

Session 4
   Structured Activity 1: Niches (Space, Time, People)
   Structured Activity 2: Nutrition Cycles (Open Data, Classification, Infrastructure)   
           
Wrap up: feedback, next steps + community actions

**Linked data goodness brought to you by elton, leif, rainer + pau**
***The colloquium is made possible by the generosity of our funders, the Andrew W. Mellon Foundation and the AHRC***


Friday 13 February 2015

Medieval sea-charts - centuries before their time

Figure 1: Annotating portolan charts in Recogito


It's hard to describe the appearance of a portolan chart - the medieval answer to the modern Admiralty chart - if you haven't already been able to see one.  Very few early examples are freely available online but you can find a chart of 1403 here: http://brbl-dl.library.yale.edu/vufind/Record/3521236. Probably originating in the 13th century, though not everybody agrees about that, the portolan charts present the Old World with immediate recognisability.  Covering the coastlines of the Mediterranean and Black Seas, along with the Atlantic shoreline up to Denmark (and the British Isles), they contradict every normal preconception about medieval cartography. You don't need to have Italy, the Nile delta, Crimea and so on pointed out.  They are where you would expect and pretty much how they ought to be.

Why Pelagios 3 devotes an entire segment to the 'portolan' world though is because of their dense toponymy. Taking into account all the islands, an average chart lists perhaps 2000 ports and harbours, as well as natural features, especially the headlands which served as reference points for sailors.

Besides the portolan charts we also have access to portolan texts or, to help distinguish the two formats, the Italian term, portolano / portolani.  Two of those survive from the 13th century, also the likely date (at its very end) of the Carte Pisane that is generally considered the oldest extant chart.  Whereas the delineation of the coastlines had, by about 1340, broadly reached the form that would be repeated for several centuries, the place-names were being steadily updated.  Given the Pelagios terminal date of 1492, that gives us a changing toponymy from three centuries of written navigational guides and two in the case of the charts.

The portolan component will both enrich Pelagios and, we hope, benefit from it. Less than half the coastal toponyms on the oldest portolani, the 'Liber de existencia riveriarum' (early 13th century) and 'Lo compasso de navegare' (dated 1296), are found on the other, and a sizeable number do not appear on the charts at all.  Likewise the toponymy of the Carte Pisane, and two other anonymous charts associated with it  (now preserved in Cortona and Lucca) partly overlap with one another but also have hundreds of names not seen elsewhere.  Considered together, these are rich sources for historians of medieval navigation and trade, since their inclusion in these works must point to them having a perceived significance at the time - even more so for the roughly one in five names that were picked out in red on the charts.

Overall, and leaving aside the islands, there are about 2000 mainland names that can be tied to a dated chart or atlas before 1492 and something like a further 600 noted only in one or other of the portolani texts or undated charts.  Conveniently, both the portolani narratives and the nautical charts provide a geographically linear toponymic catalogue for the Mediterranean and Black Sea. When the current name can be recognised in its medieval equivalent, or where the successive re-naming has been documented, those fixed points can then be used to locate the approximate present-day position of unidentified names. The most helpful source for this matching exercise will be 19th and 20th-century maps and Admiralty charts produced before expanding ports, or the general touristification of the sandy bits in between, gobbled up the old names, and often what they represented as well.  Early gazetteers can help to corroborate the guesswork.

That describes the potential contribution that the rich maritime data can make to Pelagios.  In exchange, portolan historians anticipate the help that other medieval maps and texts can give with the modern identification of some of the more elusive toponyms they have been wrestling with.  Regional historians and archaeologists may also appreciate being introduced to what will be a new source to many of them.


The toponymy for some of the portolan regions have already been documented in detail (N.E. Spain, the Adriatic and the Black Sea). Besides what is being extracted from the original documents by the Pelagios team, the remainder will be sourced from a comprehensive listing that was compiled originally in preparation for a chapter in Volume 1 of The History of  Cartography (University of Chicago Press, 1987) and then fleshed out and expanded over recent years.  The resulting Excel spreadsheet is publicly accessible at http://www.maphistory.info/PortolanChartToponymyFullTableREVISED.xls, where it forms part of a detailed ongoing investigation into the portolan charts (http://www.maphistory.info/portolan.html).

**Former map librarian of the British Library (1987-2001), since 1993 Tony Campbell has been chairman of Imago Mundi Ltd, in which capacity he acts as co-ordinator for the biennial International Conference on the History of Cartography. He is working on Pelagios 4 as the expert adviser on portolan charts.

Thursday 15 January 2015

What Do You Do with a Million Links?


Figure 1: The Pelagios 3 graph of data


The Pelagios team had a paper entitled 'What Do You Do with a Million Links?' accepted at the Digital Classics Association organised session at the Society of Classical Studies in New Orleans this month. Sadly, none of us were able to attend in person so to make our contribution we recorded an audio ppt which you can download from the link above (it's 212MB so you'll want a reasonable internet connection). Let us know what you would do with a million links!

A huge thanks to Neil Coffee and all involved for bringing the session together.